

What if your ADHD diagnosis wasn’t just a collection of behavioral checklists, but a visible, data-driven map of your unique neural architecture? You’ve likely felt the frustration of subjective assessments that leave you wondering if your brain is simply “broken” or if you’re stuck with medication as your only option. It’s exhausting to feel like you’re fighting an invisible battle without a clear strategy. At Neurobics, we believe you deserve clarity and support. Utilizing brain mapping adhd through QEEG technology, we analyze 19 distinct scalp locations to move beyond guesswork. This process provides a personalized neurological roadmap for better focus and regulation.
In this article, we’ll explore how these objective insights lead to tailored training protocols that improve executive function. You’ll discover how to transform your understanding of your brain into a practical plan for mental balance. We’ll show you how a data-driven approach fosters a sense of calm and control in your daily life. By the end, you’ll understand how to use your own neurological data to build a bridge between where you are and where you want to be.
Key Takeaways
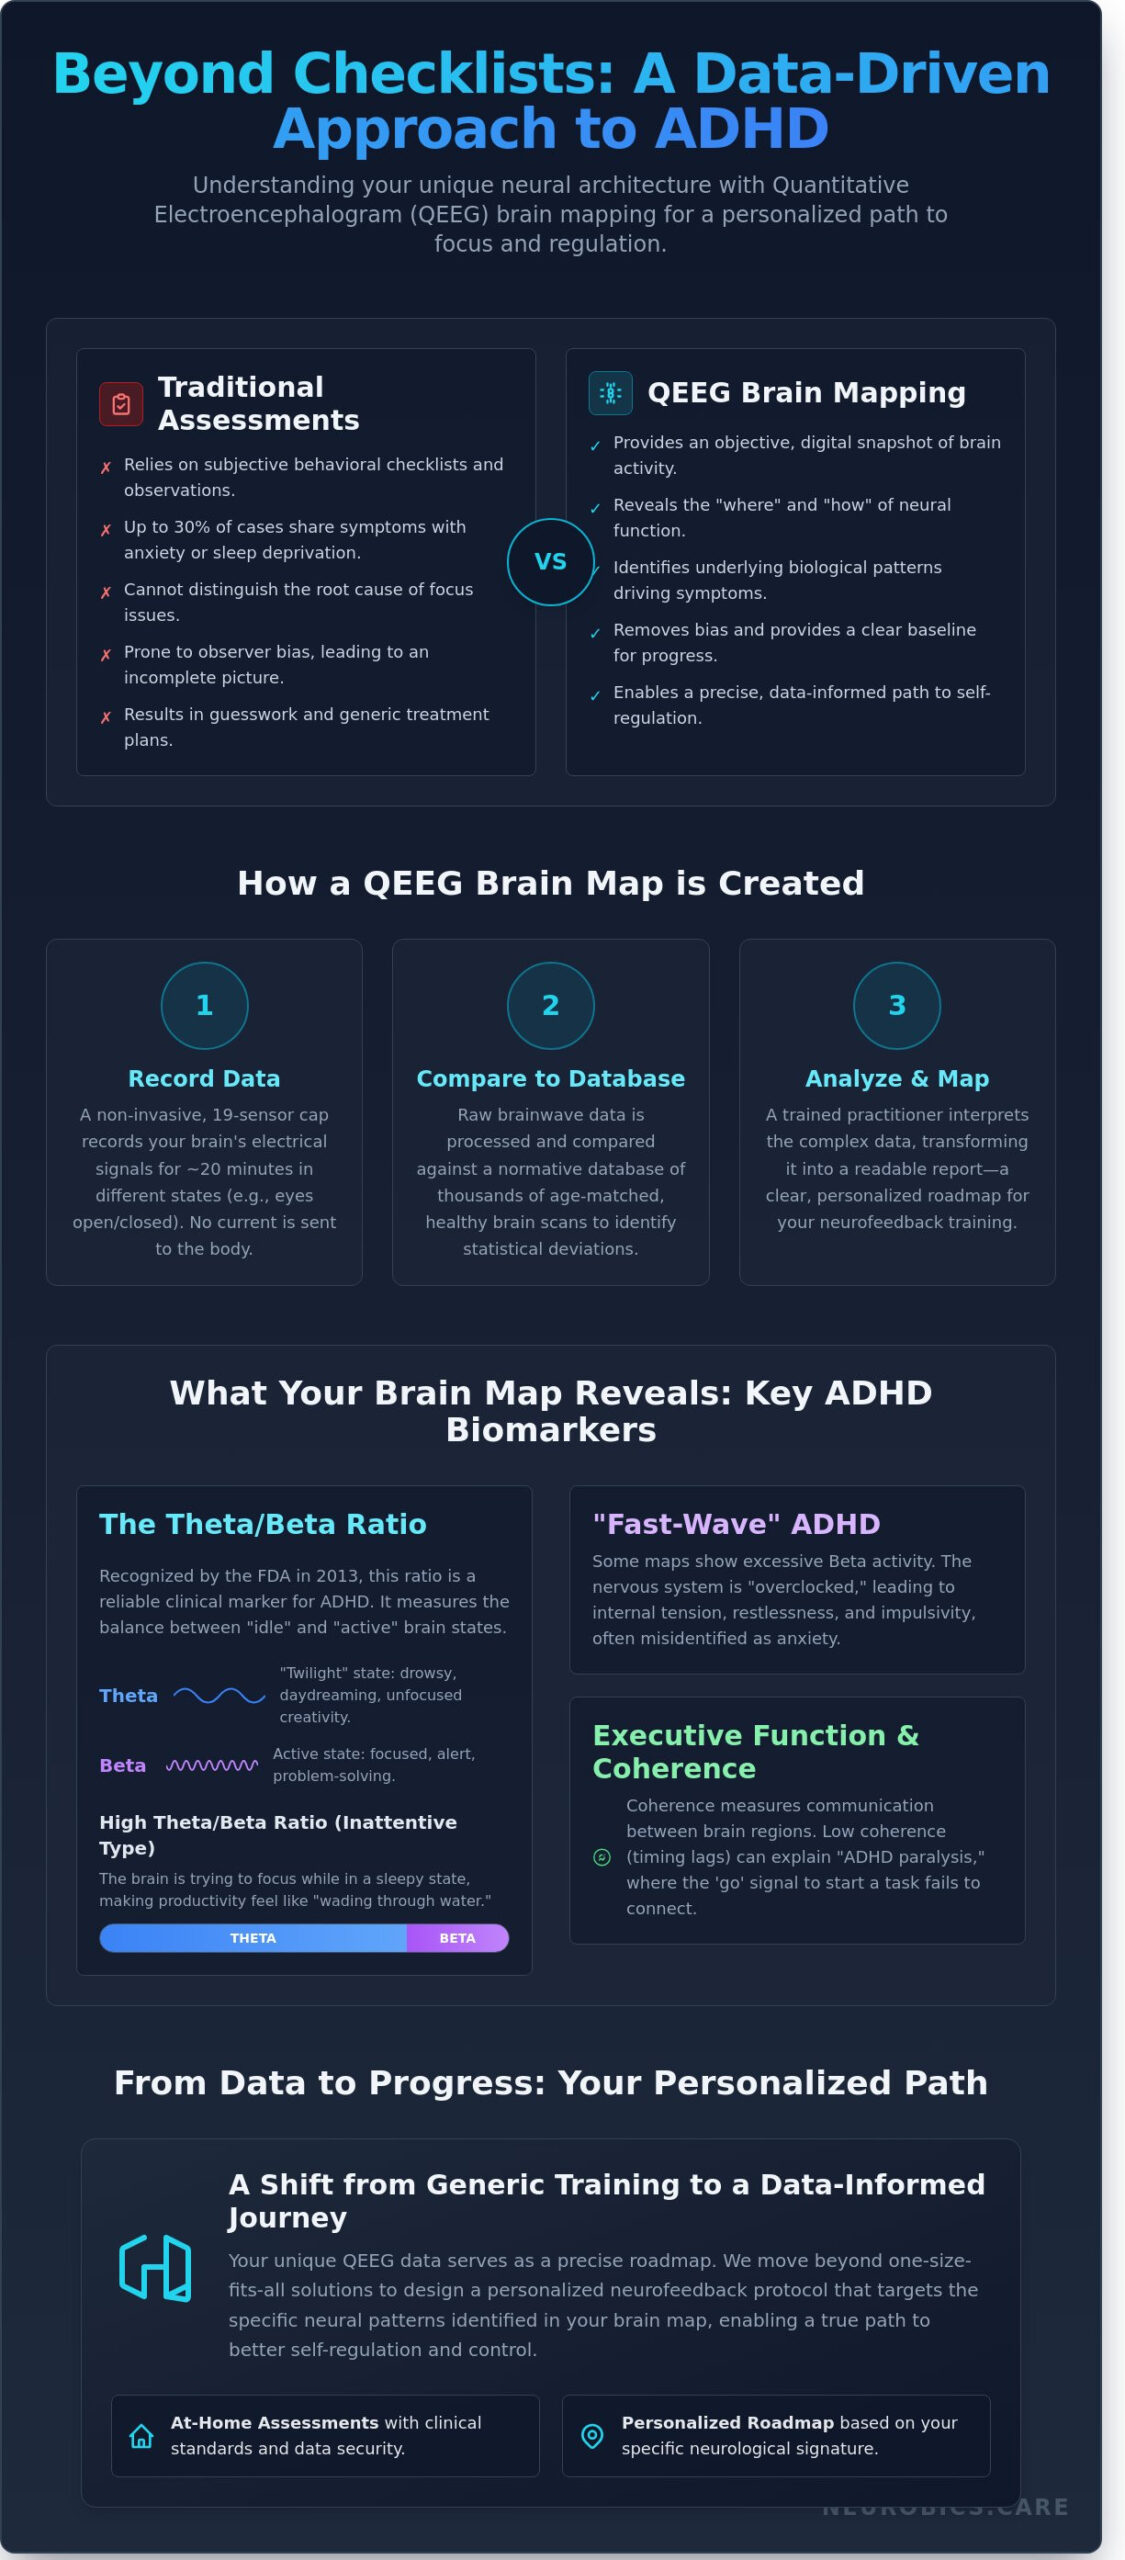
- Move beyond subjective behavioral checklists by understanding how a QEEG provides a precise digital “snapshot” of your brain’s electrical activity.
- Discover how brain mapping adhd visualizes the specific idle and active patterns in the prefrontal cortex that distinguish different neurological subtypes.
- Learn why functional QEEG data is the superior choice for designing personalized neurofeedback protocols compared to traditional structural imaging.
- Explore how Neurobics maintains clinical standards during at-home assessments, ensuring professional accuracy and data security for your remote journey.
- Understand how your unique neurological data serves as a personalized roadmap, shifting ADHD care from generic training to a data-informed path toward better self-regulation.
Understanding Brain Mapping (QEEG) in the Context of ADHD
Traditionally, ADHD is identified through behavioral observations and subjective reports. While these insights are valuable, they only describe the “what” of a person’s experience. Brain mapping adhd allows us to see the “where” and “how” of neural function. Quantitative Electroencephalogram (QEEG) acts as a digital snapshot of your brain’s electrical activity. It captures the subtle rhythms of neural communication, showing exactly which areas are working too hard or not enough. At Neurobics, we use this evidence-aware approach to move past guesswork. We focus on the underlying biological patterns that drive focus, impulsivity, and emotional regulation. This clinical precision ensures that your training plan is built on your unique neural signature, not a generic template.
What is a QEEG Brain Map?
The process involves a 19-sensor cap placed on the scalp using the international 10-20 system. This setup records electrical signals without sending any current into the body. Think of it as a thermometer for the mind; it measures temperature but doesn’t change it. We collect data for about 20 minutes across different states, such as eyes open and eyes closed. This raw data is then compared against a normative database containing thousands of age-matched, healthy brain scans. A trained practitioner interprets these complex maps to identify specific deviations. This transformation of raw waves into a readable report provides a clear roadmap for your development. It’s a non-invasive, painless way to see the brain in action.
Why Subjective Checklists Aren’t Enough
Relying solely on self-reports or teacher observations often leads to incomplete pictures. Research indicates that up to 30% of ADHD cases may share overlapping symptoms with anxiety or chronic sleep deprivation. A checklist can’t distinguish between a lack of focus caused by “slow-wave” activity in the frontal lobe and focus issues caused by “fast-wave” hyper-arousal. Objective data removes the cloud of observer bias and provides a baseline for progress. When you see your own brain’s patterns on a screen, it builds a foundation of trust in the training process. You aren’t just managing a list of symptoms; you’re engaging in a precise, data-driven process of self-regulation. This clarity helps us understand why certain strategies worked in the past while others failed. It turns a mystery into a manageable plan for growth.
The Neurology of ADHD: What the Map Actually Reveals
Brain mapping adhd provides a window into how the prefrontal cortex manages energy. In a neurotypical brain, this region “wakes up” when a task begins. For many with ADHD, the map shows a paradoxical drop in activity during concentration; the brain effectively goes into a more “idle” state when it should be most active. This neurological reality explains why trying harder often leads to more frustration rather than better results. Focus is the direct byproduct of optimal cortical arousal, where the brain maintains a precise balance between slow-wave rest and fast-wave activation.
Identifying ADHD Biomarkers: The Theta/Beta Ratio
In 2013, the FDA recognized the Theta/Beta ratio as a reliable clinical marker to support ADHD diagnosis. Theta waves represent a “twilight” state of drowsiness or creativity, while Beta waves signify active processing. When the ratio of Theta to Beta is too high, the brain is essentially trying to perform complex tasks while in a sleepy state. This leads to the classic inattentive symptoms where productivity feels like wading through water.
Conversely, some maps reveal “fast-wave” ADHD. These individuals show excessive Beta activity, which manifests as an “overclocked” nervous system. They don’t lack energy; they have too much of it. This often leads to a state of constant internal tension or impulsivity that is frequently misidentified as simple anxiety. Identifying these distinct subtypes is crucial because the support needed for a “sleepy” brain is fundamentally different from the needs of an “over-aroused” one.
Mapping Executive Function and Focus Deficits
Executive function relies on “coherence,” which is the mathematical measurement of how different brain regions communicate. When we look at a QEEG report, we often see timing lags between the frontal lobes and the rest of the brain. These communication gaps explain “ADHD paralysis,” where the intention to start a task exists, but the neurological “go” signal fails to reach its destination.
Brain fog isn’t just a feeling. It appears on the map as low-magnitude activity in the areas responsible for clarity and decision-making. By identifying these specific data points, we can move away from vague labels and toward a targeted plan for development. If you’re curious about how your own brain patterns influence your daily focus, you can connect with our team to discuss a personalized assessment. This data serves as a baseline for growth, allowing us to track how your nervous system gains resilience over time.
Brain Mapping vs. Traditional ADHD Assessments
Traditional ADHD evaluations often rely on clinical interviews and subjective rating scales. These tools are vital for a medical diagnosis, but they don’t capture the real-time electrical rhythms of the brain. When we look at brain mapping adhd, we’re moving from observing symptoms to measuring function. While an MRI provides a high-resolution photograph of the brain’s physical structure, it remains a static image. It can’t show how your brain processes information while you’re trying to focus or manage an impulse. In contrast, a QEEG records electrical activity at a rate of 256 to 512 samples per second, offering a dynamic view of how different regions communicate. This functional data is what makes neurofeedback possible. Understanding the Neurofeedback Therapy Cost involves recognizing the value of this precision; you aren’t just paying for sessions, you’re investing in a personalized map that guides every step of the training.
Moving Beyond Behavioral Observations
Behavioral assessments tell us what is happening, like a child struggling to stay in their seat or an adult losing track of deadlines. Brain mapping identifies the ‘why’ behind these actions. By capturing the brain’s unique electrical signature, Neurobics practitioners can see if a person’s focus issues stem from an over-aroused nervous system or an under-active frontal lobe. A 2022 meta-analysis highlighted that specific EEG patterns, like the theta-beta ratio, can distinguish ADHD subtypes with up to 88% accuracy. This functional map is far more actionable for self-regulation than a structural scan because it shows exactly which frequencies need to be balanced to improve daily life.
Complementary Tools in ADHD Care
Brain mapping doesn’t replace traditional care; it enhances it. It works as a cornerstone alongside Cognitive Behavioral Therapy (CBT) or nutritional adjustments to provide a holistic view of a person’s well-being. At Neurobics, the journey begins with a thorough intake assessment to determine if a full QEEG is the right next step. This process ensures the training is sophisticated and professional, avoiding a one-size-fits-all approach. By integrating these tools, we create a support system where the data from the map informs the strategies used in therapy, making the path to mental clarity more efficient and grounded in science.
The difference between a medical diagnosis and a functional brain performance assessment is clarity. A diagnosis provides a label, which is often necessary for school or work accommodations. However, a functional assessment provides a strategy. It moves the conversation away from “what is wrong” and toward “how can we optimize this system.” This shift in perspective is empowering, as it transforms a clinical observation into a tangible roadmap for growth and development.
The At-Home QEEG Process: Professional Accuracy from Your Living Room
Many people feel a natural sense of hesitation when visiting clinical environments. This “white coat effect” can lead to elevated heart rates and altered brainwave patterns, which might skew the results of a neurological assessment. By bringing brain mapping adhd protocols into your own living room, we capture a more authentic baseline of your neural activity. You’re in your own chair, in your own light, and at your own pace. This comfort isn’t just about convenience; it’s about data integrity. For those located far from a specialized facility, QEEG brain measurement international services make it possible to access clinical-grade neurological assessments without the stress of traveling to a distant clinic.
Neurobics maintains clinical standards by providing the same medical-grade EEG hardware used in top research facilities. We ship a specialized kit directly to your door, including a high-density sensor cap and a precision amplifier. To ensure total privacy, your data is encrypted using 256-bit protocols before it’s transmitted to our secure servers for analysis. This remote model allows us to support clients globally while maintaining the rigorous oversight of a traditional lab setting.
Preparing for Your Remote Brain Measurement
Setting up the hardware is a structured, step-by-step process that we guide you through during a live support session. You’ll need to find a quiet space away from large appliances like refrigerators or air conditioners, as these can create 60Hz electrical interference that “muddies” the EEG signal. Your skin preparation is equally vital. We provide a gentle exfoliating gel to ensure that the sensors achieve low impedance, ideally below 5 kOhms, which is the gold standard for a crisp, clean recording.
Your physical state also plays a major role in the quality of the baseline. Research indicates that even 2 hours of sleep deprivation can significantly alter theta-beta ratios, which are key markers in ADHD assessments. We recommend drinking 500ml of water an hour before your session to improve skin conductivity and ensure you’re well-rested. These small details ensure that the brain mapping adhd data we collect is a true reflection of your cognitive landscape.
Expert Analysis and the Oral Report
Once your recording session is finished, the raw data undergoes a sophisticated cleaning process to remove artifacts like eye blinks or muscle tension. Our practitioners then compare your unique brainwave patterns against normative databases containing thousands of individual profiles. This comparison allows us to identify specific “outliers.” For instance, we might find that your frontal lobes show a 25% increase in slow-wave activity compared to the average, which often explains why staying focused feels like an uphill battle.
The transition from complex graphs to actionable insight happens during your Oral Report. We don’t just hand you a stack of technical charts; we sit down with you to explain the findings in plain English. We’ll show you exactly where your brain is working efficiently and where it’s getting stuck in loops of over-arousal or under-arousal. This session turns “raw data” into a personalized roadmap for your self-regulation journey.
From Data to Progress: Customizing Your Neurofeedback Protocol
A QEEG provides a high-definition view of your neural landscape. It moves us away from the outdated “one-size-fits-all” approach that often leaves individuals with ADHD feeling frustrated. Instead of guessing, we use the data from your brain mapping adhd session to build a precise training plan. For those using our remote systems, this map ensures every session at home is as targeted as an in-clinic visit. It acts as a bridge between clinical science and the comfort of your living room.
Neurobics views the brain map as a living document. It’s a tool for empowerment rather than a static label. We don’t use these results to box you into a diagnosis; we use them to identify the specific levers we can move to improve your quality of life. This data-informed strategy means we aren’t training the “average” brain. We’re training your brain, respecting its unique strengths and challenges.
Translating Maps into Training Protocols
The map identifies exactly which brainwave frequencies are out of balance. If the map shows excessive theta waves in the prefrontal cortex, we set the software to reward the brain when it produces more beta waves. This process uses operant conditioning, a learning principle where the brain receives positive feedback for hitting specific targets. Research from clinical studies often shows that these personalized protocols lead to measurable improvements in attention and impulsivity within 20 to 40 sessions. In many settings, up to 80% of individuals report better self-regulation after completing a map-guided program. By rewarding the brain for reaching its goal state, we help it build sustainable neural pathways.
The Path to Improved Self-Regulation
Seeing your brain’s activity on a screen often changes how you view yourself. It shifts the narrative from “I’m lazy” to “My brain is producing too much slow-wave activity in certain areas.” This realization often reduces the chronic shame associated with ADHD. It turns a mystery into a manageable project. Understanding your neurology increases motivation because the path forward is visible and logical. We don’t just rely on how you feel; we conduct follow-up scans every 20 sessions to compare them against your original baseline. This visual evidence of progress provides a sense of mastery over your own mental state. If you’re ready to see what your unique neural roadmap looks like, you can contact us for a personalized discussion of your mapping needs.
Mapping Your Path to Lasting Focus
Understanding the unique electrical patterns of your brain changes the way you approach focus and regulation. By utilizing brain mapping adhd protocols, we move past subjective observation and rely on objective, measurable data. Our team brings 15+ years of practitioner expertise to interpret these maps, ensuring your neurofeedback journey is built on a solid foundation of normative data. This precision allows us to create a roadmap that’s tailored specifically to your nervous system’s needs.
You don’t have to navigate this process alone or visit a clinical setting to get professional results. Our remote support model brings clinically-informed assessments directly into your home. We provide the tools and guidance needed to translate complex neurological data into practical steps for daily improvement. It’s a modern, accessible way to find balance through science and personalized care. We’ve designed this process to be as supportive and clear as possible, removing the guesswork from your mental development.
Ready to see what your brain is telling you? Book Your Professional At-Home Brain Mapping Assessment and start building a more regulated future today. Taking the first step toward understanding your own neurology is a powerful act of self-care, and we’re here to support your progress every step of the way.
Frequently Asked Questions
Is brain mapping a tool used to diagnose ADHD medically?
QEEG brain mapping adhd assessments aren’t standalone medical diagnostic tools; rather, they provide a functional map of how your brain processes information. While a clinical diagnosis relies on DSM-5 criteria and behavioral assessments, the brain map identifies specific patterns like high theta-to-beta ratios. This data helps Neurobics tailor self-regulation strategies to your unique neurological profile, ensuring your training plan is based on data rather than guesswork or generic assumptions.
How long does a QEEG brain mapping session take at home?
A remote QEEG brain mapping session usually takes between 30 and 45 minutes from start to finish. This includes the time needed to fit the headset and ensure a clean signal. The actual recording of brainwave data typically lasts only 10 to 12 minutes, split between eyes-open and eyes-closed states. It’s designed to be efficient and comfortable within your own home environment, fitting easily into a busy schedule.
Can a brain map show the difference between ADHD and anxiety?
Yes, a brain map can distinguish between the physiological signatures of ADHD and anxiety. ADHD often presents as excess slow-wave activity in the frontal lobes, while anxiety typically shows up as high-frequency beta waves or over-arousal in the limbic system. By identifying these distinct markers, we can better understand why you might feel restless or unfocused. This clarity helps us choose the right protocols to help you find balance and focus.
Do I need to stop taking my ADHD medication before a brain map?
You don’t necessarily need to stop your medication, but you should discuss it with your consultant first. Stimulants can alter brainwave patterns within 30 to 60 minutes of ingestion, which might mask your baseline state. If the goal is to see how your brain functions naturally, a 24 to 48 hour washout period is sometimes recommended under medical supervision. We’ll work with you to decide the best approach for your specific goals.
Is brain mapping for ADHD covered by insurance in the UK or Netherlands?
In the UK and the Netherlands, brain mapping adhd protocols are rarely covered by standard statutory insurance like the NHS or Basisverzekering. Most clients pay privately, though some premium Dutch “aanvullende” policies may offer partial reimbursement for neurofeedback-related assessments. It’s best to check your specific policy for “alternative therapies” or “preventative mental health” codes before booking. We can provide the necessary documentation to help you claim any available benefits.
What is the difference between a standard EEG and a QEEG brain map?
A standard EEG records raw electrical activity to detect gross abnormalities like seizures, while a QEEG brain map processes that data through a normative database. This comparison allows us to see how your brainwaves deviate from a healthy peer group of the same age. At Neurobics, we use this quantitative data to create a precise roadmap for your personal development, moving beyond simple observation to detailed, data-driven analysis.
Can children with ADHD sit still long enough for a brain map?
How often should I get a new brain map during neurofeedback training?
We recommend a new brain map every 20 to 30 neurofeedback sessions to track your progress effectively. This interval allows enough time for the brain’s plasticity to create measurable changes in self-regulation. Comparing these maps provides objective evidence of how your neural pathways are strengthening, allowing us to adjust your training protocol for the best possible results. It’s an essential part of ensuring your development stays on the right track.
