


What if the colored maps and complex graphs of your brain scan weren’t a test you could pass or fail, but a conversation your nervous system is finally having with you? It’s completely natural to feel a sense of overwhelm or even a bit of anxiety when you first look at a report. Seeing your inner world translated into technical data can feel like trying to read a map in a language you haven’t learned yet. This guide will walk you through the process of understanding your qeeg results, helping you see past the jargon to the meaningful patterns that explain why you feel the way you do.
We’ll explore how these biological markers, from potential ADHD indicators to specific stress patterns, become the exact blueprint Neurobics uses to build your personalized at-home training protocol. You’ll learn what different brain wave bands signify and how they correlate with your daily experience of focus, sleep, and emotional regulation. By the end, you’ll see your brain map not as a source of confusion, but as a clear roadmap toward a more balanced and capable version of yourself.
Key Takeaways
- Learn the difference between a medical EEG and a QEEG, which acts as a functional roadmap of your brain’s unique communication patterns.
- Discover how specific brain wave frequencies, from deep sleep to high-intensity focus, correlate with your real-world symptoms and mental performance.
- Gain clarity on how normative databases and Z-scores provide context for understanding your qeeg results by comparing your data to age-matched peers.
- Identify the visual markers for common challenges like ADHD or chronic stress, allowing you to see the biological roots of your internal experiences.
- See how Neurobics translates these data points into a personalized remote neurofeedback protocol designed to help your brain self-regulate more effectively.
What is QEEG Brain Mapping? Moving Beyond Raw EEG
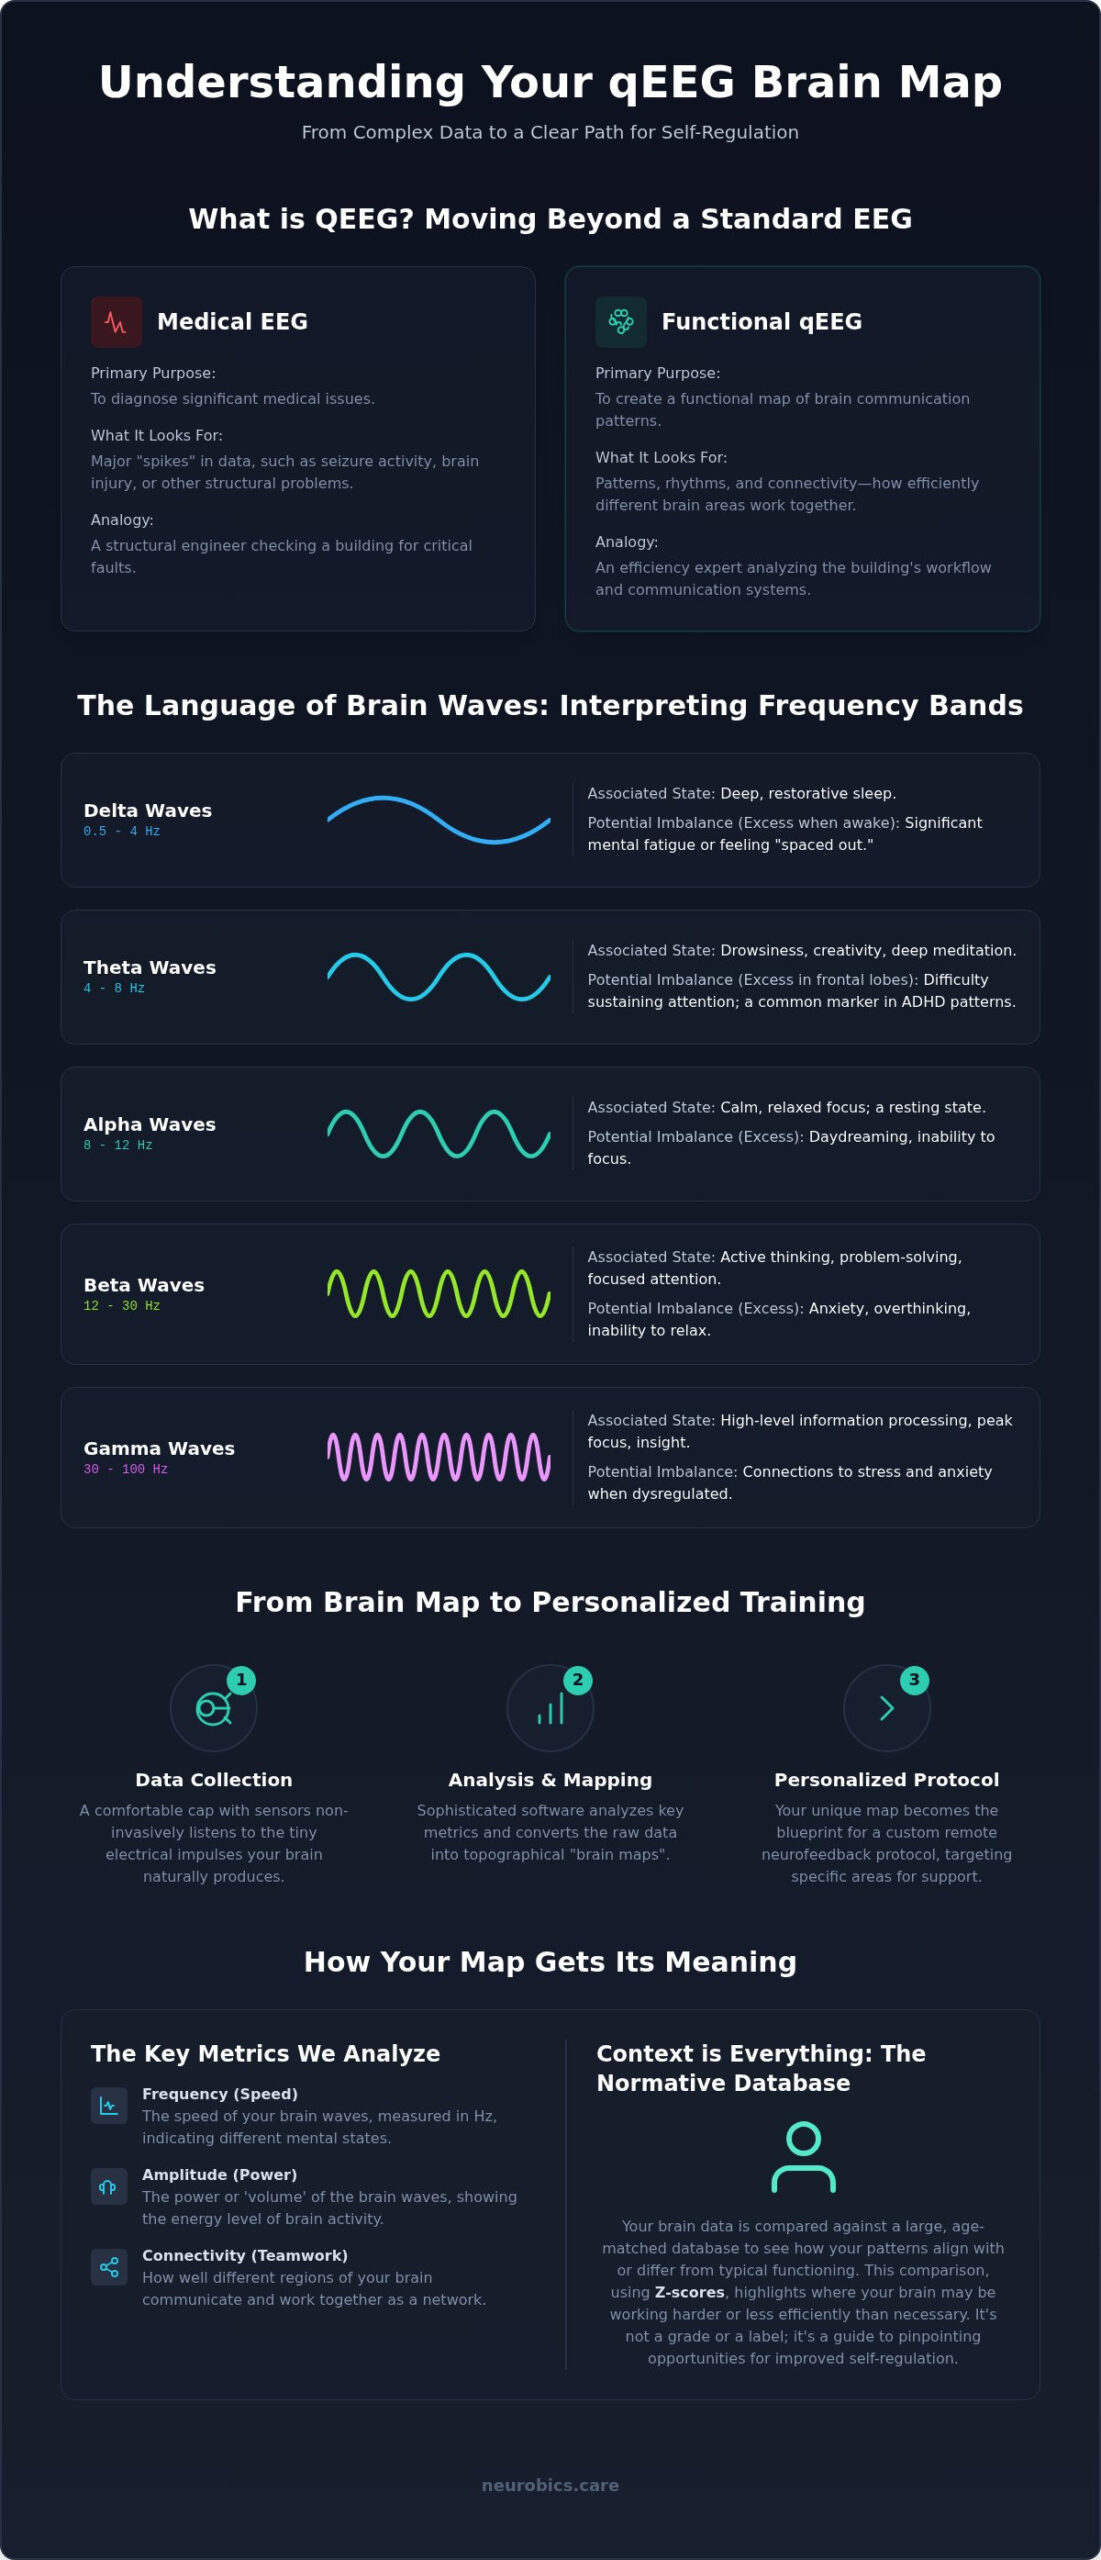
To start the process of optimizing your brain health, we first need to see how your brain is actually functioning in real-time. Most people are familiar with a standard EEG, which doctors use to look for significant medical issues like seizures or structural damage. However, Quantitative electroencephalography (QEEG) takes this a step further by using sophisticated mathematical algorithms to analyze those electrical signals. While a raw EEG shows us the ‘spikes’ in the data, a QEEG allows for deep analysis of patterns, rhythms, and how different areas of the brain communicate with each other. This data is the essential foundation for any successful remote neurofeedback training program.
The process itself is entirely non-invasive and painless. You simply wear a comfortable cap fitted with sensors that listen to the tiny electrical impulses your brain naturally produces. No electricity is sent into your body; the sensors act like a microphone for your brain waves. This data is recorded while you’re resting or performing simple tasks, providing a comprehensive snapshot of your nervous system’s current state. It’s a quiet, reflective process that captures the unique biological signature of your mind.
From Electrical Signals to Visual Maps
Once the recording is finished, the raw data undergoes a transformation. We look at three primary metrics: frequency (the speed of the waves), amplitude (the power or ‘volume’ of those waves), and connectivity (how well different brain regions work together). These numbers are then converted into topographical maps, which use colors to represent where activity is higher or lower than expected. It’s important to remember that QEEG is a functional assessment tool rather than a diagnostic one. It doesn’t label you with a disease; instead, it highlights where your brain might be working harder than it needs to. Understanding your qeeg results starts with seeing these maps as a reflection of your current internal ‘weather’ rather than a permanent personality trait.
Why Neurobics Prioritizes QEEG-Informed Care
At Neurobics, we believe that training a brain without a map is like trying to navigate a new city without GPS. Generic, ‘one-size-fits-all’ neurofeedback can be inefficient or even counterproductive because every brain has unique needs. By starting with a detailed map, we can design individualized protocols that target the specific areas needing support. This precision leads to faster and more sustainable self-regulation. Once we have your data, we walk you through it during a collaborative ‘Oral Report’ session. This is where your subjective experience meets our objective data, ensuring you’re a full partner in the process before we ship the necessary neurofeedback equipment to your home. Understanding your qeeg results is the first step in taking active control of your mental well-being.
The Language of Brain Waves: Interpreting Frequency Bands
To make sense of your brain map, we first have to understand that your brain operates at various speeds simultaneously. These speeds, known as frequency bands, are measured in Hertz (Hz) and act much like the gears in a car. A resilient, healthy brain shifts between these gears effortlessly depending on the task at hand. However, when we use a diagnostic tool that measures electrical activity, we often find that a brain has become “stuck” in a particular gear. Understanding your qeeg results involves identifying where these gears are grinding or failing to engage, which is why we categorize activity into the 5 types of EEG brain waves.
Slow Waves: Delta and Theta
Delta waves are the slowest frequencies, typically dominating during deep, restorative sleep. If your results show excessive Delta while you’re awake, you might experience significant mental fatigue or a feeling of being “spaced out.” Theta waves are slightly faster and represent the twilight state between sleep and wakefulness. While Theta is essential for creativity and memory, an overabundance in the frontal lobes is a common pattern for those struggling with focus. For example, high frontal Theta often correlates with the inability to sustain attention on mundane tasks, a hallmark of many ADHD-style patterns. Understanding your qeeg results means seeing these slow waves not as “bad,” but as rhythms that simply need to be better timed.
Fast Waves: Alpha and Beta
Alpha waves act as the brain’s neutral gear. They are most prominent when you close your eyes and relax, serving as a vital bridge between your internal thoughts and the external world. When Alpha is deficient, you might find it hard to “switch off” at the end of the day. Moving into faster territory, Beta waves represent active thinking and problem-solving. While necessary for work, “High Beta” activity often signals hyper-vigilance or anxiety. It’s like an engine idling at too high an RPM; it consumes energy without moving you forward efficiently. Finally, the Sensorimotor Rhythm (SMR) is a specialized band that promotes physical stillness and mental focus, often used as a target for stabilizing the nervous system.
State-shifting is the true hallmark of a balanced mind. A person with high resilience can focus intensely during a meeting, transition into a relaxed state during dinner, and fall into a deep sleep at night. When this flexibility is lost, symptoms like burnout or insomnia often follow. If you’re ready to see which gears your brain is currently using, reaching out for a professional measurement is the logical next step toward regaining that natural flexibility.
For professionals aiming to leverage this mental flexibility in high-stakes environments, Dr. Brian Grossman provides performance coaching that helps translate neurological insights into executive excellence.
The Normative Database: Understanding Z-Scores and ‘Typical’ Patterns
When you begin the process of understanding your qeeg results, you’ll notice that your data is compared to a vast collection of information known as a normative database. This database acts as a point of reference, containing thousands of brain maps from healthy individuals of the same age and gender. By comparing your unique electrical patterns against this statistical “average,” we can identify where your brain might be working harder or less efficiently than its peers. While the scientific community often discusses the role of QEEG in diagnosing neuropsychiatric disorders, our primary focus is using this data to understand your personal capacity for self-regulation.
The core metric we use during this comparison is the Z-score. A Z-score simply measures how far your brain activity deviates from the mean of the normative database. A score of zero means you’re exactly at the statistical average. Most people fall within one or two standard deviations, which is considered the “typical” range. However, it’s essential to understand that “average” does not always mean “optimal.” Your brain might have developed unique patterns that serve you well, even if they fall outside the statistical norm. Our goal isn’t to make your brain look like everyone else’s, but to help it function at its own best level.
Reading the Colors: Green, Red, and Blue
The topographical maps in your report use a color-coded system to make these statistical deviations easy to visualize at a glance. Understanding these colors is a key part of understanding your qeeg results:
- Green: This indicates that your brain activity in that specific frequency is within the “typical” range, usually within one or two standard deviations from the mean.
- Red and Yellow: these colors signify an “excess” of activity. It means that part of your brain is producing more power or speed in a certain frequency than is typical for your age.
- Blue: This represents a “deficiency” or low power. It suggests that a specific frequency isn’t being produced enough in that area of the brain, which can impact your ability to perform certain tasks.
Why Being ‘Out of Range’ Matters
Seeing red or blue on your map isn’t a cause for alarm; it’s a clue. These deviations often represent an “Endophenotype,” which is a stable brain pattern that can explain why you experience certain cognitive or emotional challenges. Sometimes, a deviation is actually a compensatory pattern, your brain’s way of working around a different struggle. For instance, a Z-score of +3 in Beta might explain why you feel ‘wired but tired’, as your nervous system is stuck in a state of high-intensity arousal even when you’re trying to relax. By identifying these signatures, we can move away from guessing and toward a precise, data-driven plan for your growth. If these patterns resonate with your daily experience, connecting with a specialist can help you translate these colors into a clear path forward.
Identifying Common Markers: ADHD, Anxiety, and Stress Patterns
One of the most empowering aspects of understanding your qeeg results is seeing your subjective struggles reflected in objective data. It validates your experience. It’s not just a feeling; it’s a visible pattern in your brain’s electrical activity. We look for specific signatures that correlate with how you navigate focus, stress, and rest. These markers act as a biological confirmation of why certain tasks feel more difficult for you than for others, removing the weight of self-blame.
Visualizing ADHD and Focus Issues
The most well-studied biomarker in this field is the Theta/Beta ratio. In many cases of neurofeedback for ADHD, we see an excess of slow Theta waves in the frontal lobes compared to faster Beta waves. This essentially means the “executive center” of the brain is under-aroused, making it difficult to filter out distractions or stay on task. It’s like your brain is trying to drive in a low gear when it needs to be on the highway. Brain mapping ADHD can also provide clues as to why stimulants might be effective for some but cause jitteriness for others. If your frontal lobes are already in a state of high arousal, adding a stimulant could push you into an ADHD Paralysis state, where the brain effectively freezes under too much pressure.
Stress and Emotional Regulation
Anxiety often leaves a different trail. We frequently see “High Beta spindles,” which are short bursts of high-frequency activity that keep the brain in a state of hyper-vigilance. This “busy brain” pattern makes it nearly impossible to find an “off” switch at night. Another critical marker is Alpha-Intrusion. This happens when Alpha waves, which should be active during quiet relaxation, “intrude” upon your deep sleep Delta waves. It’s a common signature of burnout; you might spend eight hours in bed but wake up feeling like you haven’t rested at all because your brain never fully disengaged. It stayed in a shallow, watchful state all night.
We also examine asymmetry between the left and right hemispheres. A healthy brain maintains a specific balance; when the right side becomes significantly more active in certain frequencies, it often correlates with a more withdrawal-oriented or anxious mood. Understanding your qeeg results allows us to see these biological roots of intrusive thoughts or chronic stress. If you recognize these patterns in your own daily life, scheduling a professional brain measurement can provide the clarity needed to start your journey toward better self-regulation.
From Map to Motion: How Results Inform Your Remote Training
Understanding your qeeg results is the bridge between knowing there’s a struggle and actually solving it. Once the colors and Z-scores have been analyzed, we move into the most critical phase: Protocol Design. This is where we turn your biological roadmap into a set of specific instructions for your nervous system. By identifying the exact areas where your brain is struggling to self-regulate, we can create a plan that’s as unique as your thumbprint. We don’t guess; we use the data to drive every decision.
At Neurobics, we use this data to determine the precise placement of sensors and the frequency thresholds for your training. If your map revealed an excess of slow wave activity in the areas responsible for focus, your protocol will be designed to reward faster, more alert rhythms while inhibiting those ‘distraction’ waves. This isn’t a passive process. It’s a form of mental exercise that strengthens your brain’s ability to shift states on demand. To make this possible, we ship professional grade neurofeedback equipment directly to your door, allowing you to train in the environment where you feel most comfortable.
Your Personalized Training Protocol
The software we provide acts as a mirror for your brain. As you watch a movie or listen to audio during your sessions, the system monitors your EEG signals in real-time. When your brain hits the target frequency, the ‘Focus’ gear we’ve identified on your map, the screen stays bright or the volume remains clear. If your brain slips back into an old, less efficient pattern, the feedback changes. This real-time loop is what allows for lasting neuroplastic change. Because we target the specific regions identified in your QEEG, the training is much more efficient than generic, non-mapped methods.
The Power of Professional Guidance
While technology makes at-home training convenient, professional oversight is what makes it effective. A common mistake is the move toward DIY neurofeedback without a baseline map. Without understanding your qeeg results first, you risk training the wrong areas or reinforcing patterns that could lead to increased anxiety or sleep issues. Our experts review your data remotely to ensure you’re progressing safely. We typically recommend a follow-up QEEG after 20 to 40 sessions to see how your brain has physically changed. This ensures your roadmap is always up to date and reflects your actual growth.
Ready to see your brain’s roadmap? Book your at-home QEEG assessment with Neurobics today.
Your Path to Lasting Self-Regulation Starts Here
Seeing your brain’s activity translated into colors and graphs is the first step toward meaningful change. By moving past technical confusion and truly understanding your qeeg results, you gain a clear perspective on how your nervous system manages focus, rest, and stress. This clarity replaces uncertainty with a concrete plan, shifting the focus from what’s “wrong” to how you can develop your brain’s natural capacity for balance and resilience.
This focus on cognitive resilience is especially relevant for leadership roles. For organizations looking to apply similar rigorous standards to their talent acquisition, McKenzie Assessment provides expert executive hiring risk and candidate assessment services.
At Neurobics, we combine 15+ years of clinical expertise with advanced 19-site brain mapping to ensure your journey is both precise and supportive. Our expert-guided remote sessions bring professional care directly into your home, providing the tools you need to achieve sustainable self-regulation. You don’t have to navigate this process alone; our team is here to help you interpret every data point and adjust your training for the best possible outcomes. It’s about turning complex biological data into a practical, daily practice for a better quality of life.
Discover your brain’s unique profile—Book a QEEG assessment with Neurobics
Your brain possesses an incredible ability to adapt and grow through the right training. With this biological roadmap in hand, a calmer and more focused life is well within your reach.
Frequently Asked Questions
Is a QEEG brain map a medical diagnosis for ADHD or anxiety?
A QEEG brain map is not a medical diagnosis for ADHD or anxiety. Instead, it provides a functional assessment of your brain’s electrical activity. While it identifies biomarkers frequently associated with these conditions, it’s used at Neurobics to guide protocol design rather than to label a clinical disorder. A formal diagnosis must always come from a qualified psychiatrist or medical professional through a separate clinical evaluation.
Can a QEEG see my thoughts, memories, or personality?
No, a QEEG cannot see your thoughts, memories, or specific personality traits. It only records the speed and power of the electrical signals produced by your neurons. Think of it as measuring the “rhythm” of a song without knowing the lyrics. Your private thoughts, feelings, and life experiences remain entirely your own throughout the recording process; the technology simply doesn’t have the capacity to read them.
How long does a QEEG measurement take at home?
An at-home QEEG measurement usually takes between 45 and 60 minutes to complete. This timeframe includes the setup needed to fit the sensor cap and ensure a clean signal. The actual data collection typically involves 10 minutes with your eyes open and 10 minutes with your eyes closed. It’s a straightforward, non-invasive process that fits easily into a morning or afternoon session without any physical discomfort.
Why do I need to avoid caffeine before my QEEG recording?
You need to avoid caffeine because it’s a stimulant that temporarily alters your brain wave patterns. It can artificially increase high-frequency Beta activity, making your brain appear more “wired” or anxious than it naturally is. To ensure accuracy in understanding your qeeg results, we need to capture your nervous system in its baseline, unadulterated state. This provides the most reliable data for your training.
How often should I get a new QEEG map during my training?
We generally recommend a follow-up QEEG map after every 20 to 40 neurofeedback sessions. This allows us to objectively track your physical progress and see how your brain has responded to the training. These updates are vital for refining your protocol and ensuring that your training remains aligned with your brain’s evolving needs. It’s a collaborative way to verify that your self-regulation is improving over time.
Can a QEEG detect if I have had a past concussion or TBI?
A QEEG can identify specific markers, such as localized clusters of slow wave activity, that are often associated with past concussions or traumatic brain injuries. While it doesn’t replace an MRI or a clinical medical diagnosis, it’s highly effective at showing how a historical injury might still be affecting your cognitive function and daily energy levels. This information helps us target the right areas during your training.
What is the difference between a raw EEG and a Quantitative EEG?
A raw EEG is a visual record of brain waves used primarily by doctors to spot major medical issues like seizures. In contrast, a Quantitative EEG uses mathematical analysis to compare your data to a normative database. This statistical approach is what allows us to identify the subtle functional patterns necessary for creating a personalized neurofeedback plan, moving beyond simple visual inspection of the wave spikes.
Do my QEEG results stay the same forever, or can they change?
Your QEEG results are a snapshot in time and are not permanent. Because of neuroplasticity, your brain’s electrical patterns can and do change through consistent training, neurofeedback, and lifestyle shifts. Understanding your qeeg results as a dynamic roadmap rather than a fixed label helps you see that your current state is something you can actively influence and improve through dedicated, methodical work and professional guidance.
